Features
Capture the data
You can capture the KPI’s of your company in a user friendly way. The interface is intuitive and supports plug&play.
The questions are structured along six topics: general, processes / technology, efficiency, quality, employees and clients. The questions are numbered. To facilitate the recording of the data, you can choose to display the values of the previous year, if they are available. Help texts are available and often include a precise definition oft he KPI.
While clicking through the survey some first results will be calculated and useful information is displayed. At the end of the survey you can print a pdf-report with your KPIs. Thus already by participating in the survey you gain valuable insight at no cost.
The data are kept strictly confidential as a matter of course, market- and peerdata are presented in a format that does not allow to conclude to a single company.

Display and benchmarking
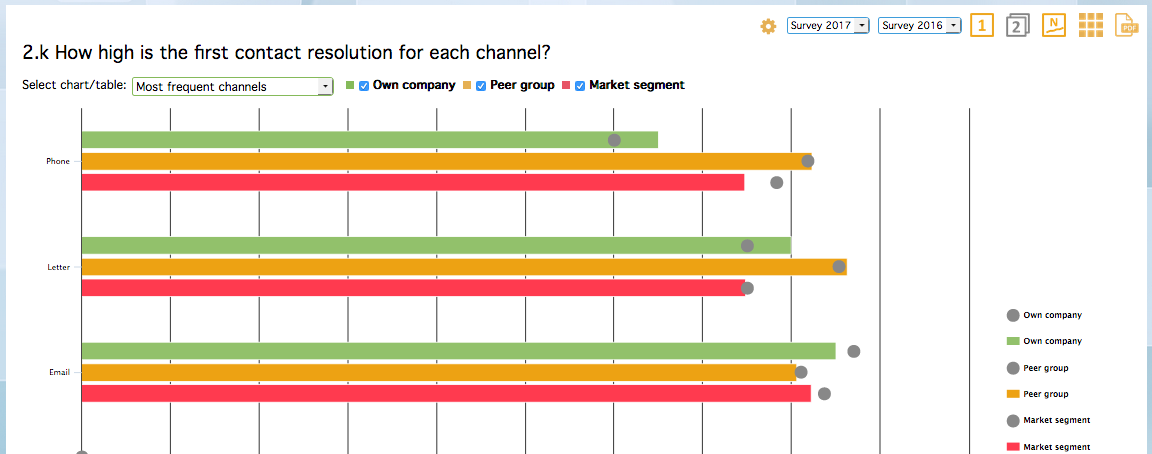
In the online cockpit your service center KPIs are presented compared to the market data and the selected peer groups. With that you receive for the first time consistent benchmarks and standards and furthermore you see at a glance, how your service center is positioned vis-a-vis the market and the competitors.
You can choose how you want to display your data as a chart or as a table and if you want to show one year or multiple years. Furthermore it can be exported as a pdf or copied in excel.

You (green) are always part of a peergroup (yellow), the market segment (red) however can be selected freely. Like that you can compare yourself for example with service centers in a different country.
You can select one or multiple of these peergroups and market segments:
- Country
- Industry
- Services
- Type of client
- Type of service center
- Company size
- Share outsourcing
- Number of contacts
With a company group account you can compare your various service centers and conduct an internal group benchmarking.